Dynamics and Cooperativity of Microtubule Decoration by the Motor Protein Kinesin

1. Introduction

We study a model for the binding of dimeric kinesin to microtubules, as described in Journal of Molecular Biology 312:1011-1026 (2001). The aim of the simulation is to show how dimeric motors decorate the microtubules if both single- and double-headed binding is allowed and to demonstrate that a model with nearest neighbor interaction can explain the observed lateral alignment of kinesin dimers and the all-or-nothing decoration.

2. Model defintion

Microtubules or tubulin sheets are represented by a lattice of white (alpha-subunit) and grey (beta-subunit) spheres. Kinesin heads bind to beta tubulin subunits. They are represented by two red spheres, connected by a line, when a dimer bound with both heads. When bound with a single head, the bound head is shown red and the tethered head green.

A kinesin dimer can bind with one head or with both heads. The transition rates are the following:

Reaction scheme

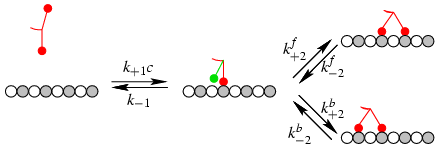
  • k+1 c (1-n cTubulin / c) Association rate for the first head
  • k+2b Association rate for the second head left of the first one
  • k+2f Association rate for the second head right of the first one
  • k-2b Dissociation rate for the left head of a double-bonded dimer
  • k-2f Dissociation rate for the right head of a double-bonded dimer
  • k-1 Dissociation rate for a single-bonded dimer

These rates relate to the binding constants for the first (K1) and the second (K1) head in the following way:

K1 = k+1 / k-1
K2 = k+2f / k-2f = k+2b / k-2b.

Interactions

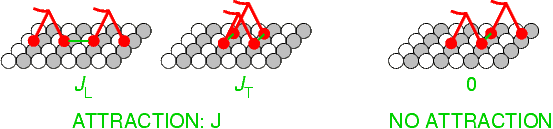
Two dimers bound next to each other on the same protofilament or beside each other on neighboring protofilaments are subject to an attractive interaction with strength JL (longitudinal) or JT (transverse). Two dimers bound on neighboring protofilaments shifted by one tubulin subunit (8nm) are not subject to any interaction.

Each bound neighbour influences the attachment rate of a head by the factor AL,T and the detachment rate by the factor BL,T. The interaction constants relate to these factors as

JL=kBT ln(AL / BL )
JT=2kBT ln(AT / BT )

n denotes the current stoichiometry (number of bound heads per lattice site) and reduces the concentration of dissolved kinesin to c(1-n cTubulin / c).

3. Simulation


Your browser can't run 1.1 Java applets. Make sure that you use a Java 1.1 capable browser (e.g. Netscape 4 or newer) and that Java is turned on.

Alternatively, you can view two examples of the simulation as animated gif files here.


n= average total number of bound heads per lattice site

4. Predefined parameter sets

Nine parameter sets showing interesting cases can be retrieved through the menu. These include:
  1. Monomers, no interaction: Monomeric kinesin heads bind to the lattice independently. The stoichiometry obeys the simple form of Langmuir's isotherm.
  2. Monomers, attractive interaction: Monomeric kinesin heads binding to the lattice with the same attractive interaction as in set 6., which however is not sufficient to produce all-or-nothing decoration.
  3. No interaction, single-headed binding: Dimers can only bind with one head, i.e. K2=0. This situation has been found with ncd (e.g. Sosa et al., 1997). The stoichiometry obeys the simple form of Langmuir's isotherm.
  4. No interaction, double-headed binding: With K2=100, the dimers are only likely to bind as whole. The model was proposed for double-headed kinesin (e.g. Hoenger et al., 1998, Thormählen et al., 1998)
  5. No interaction, combined binding: With K2=1, the single- and the double-bonded state are competing for the places on the lattice, as observed with double-headed kinesin (Hoenger et al., 2000).
  6. Annealing: With a medium interaction strength and a sufficiently high kinesin concentration c, the decoration will start at many sites simultaneously. The boundaries between the domains that grew from different nuclei will heal in a slow annealing process (Vilfan et al., 2001).
  7. Single-site nucleation 1: With a stronger interaction and a solution concentration close to the phase transition, it takes a longer time to form a stable nucleus than for this nucleus to cover the whole lattice. Therefore, the lattice will most probably be covered starting from a single nucleus and therefore free of defects.
  8. Single-site nucleation 2: Like above, but with a stronger interaction, which makes the effect more pronounced.
  9. Strong longitudinal, no transverse interaction: In this mode the lattice gets covered in longituinal strips.
The parameter values for annealing and single-site nucleation shown in the following phase diagram:

Image: Phase diagram

Sets #6 and #7 can also be viewed as pre-recorded animation here.

5. Links

6. Authors

Andrej Vilfan Manfred Thormählen
Erwin Frey Young-Hwa Song
Franz Schwabl Eckhard Mandelkow
Valid HTML 4.01! © Andrej Vilfan, 1999,2001